
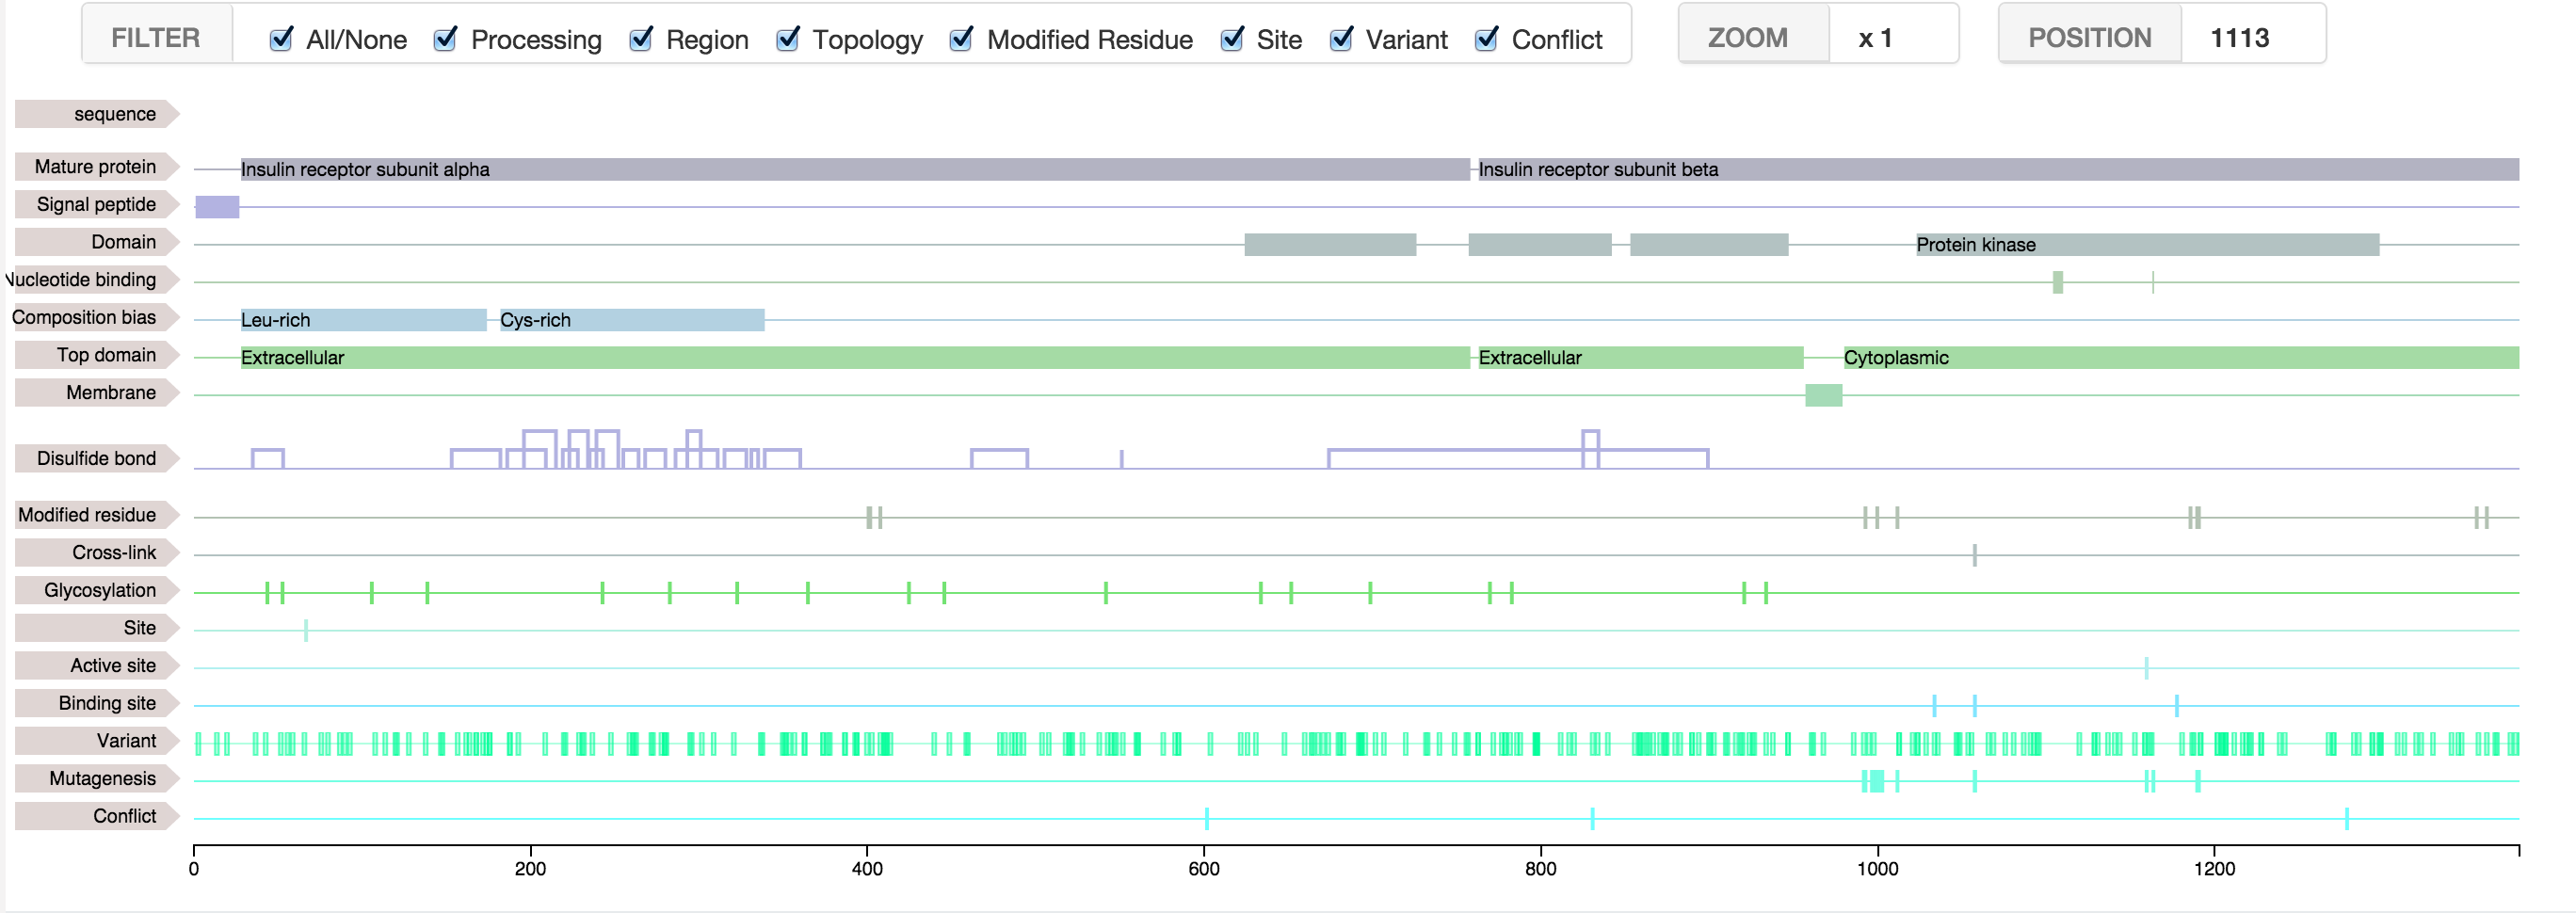
Feature Viewer
This javascript tool based on the library D3, will allow you to display the features covering your sequence of DNA, protein, or others.
Step 1 - Initialize the Feature Viewer
You will first need to create the SVG that will contains the features.
To do so, give whithin the parameters, the sequence (or length) and the div in which the features will be
display.
You can also adjust some rendering options :
- showAxis (boolean) : Display or not the x-Axis
- showSequence (boolean) : Display or not the sequence
- brushActive (boolean) : Active or not the brush zoom
- toolbar (boolean) : Add a header on top of the svg, showing level of zoom & the mouse position in the sequence.
- bubbleHelp (boolean) : Add a bubble help in the header to indicate how to zoom. Requires the toolbar.
- zoomMax (int) : Define the maximum range of the zoom. Must be a multiple of ten.
- units (string) : Define units used.
- dottedSequence (boolean) : Dotted line when sequence too long to be displayed.
- animation (boolean) : Animation during transition
- offset (object) : Specify an offset (offset.start should always be > 0).
Ex : offset:{start:40,end:100}
The brush zoom will allow you to select a part of the sequence to zoom in.
It may happen that the div is too small to display the sequence, but a zoom will make it
appears.
To zoom out, just do a right click.
Step 2 - Add some features
To add a feature to the SVG you have to pass an object as parameter.
This object will take :
- data (array of objects) : An array of objects, each containing :
- x (int) :
- first position
- y (int) :
- last position (or a value for features of type "line")
- id (string) :
- an Id (Optionnal)
- description (string) :
- Small description (Optionnal)
- color (string) :
- a custom color (Optionnal)
- name (string) : The name of theses features, which will be display as a label on the Y-axis
- className (string) : a class name, for further personnal computing
- height (int) : height of the feature (default: 12)
- color (string) : The color of the features
- type ("rect","path", "line") : The type of feature, for a specific rendering
- interpolation ("basis","step","monotone",..) : Customize the layout of a the line
(Only for the "line" feature)
Note 1 : In case of "line" feature, you can add 2 arrays of data within an array (e.g. data:[dataArray1,dataArray2]), and 2 colors for each data within an array (e.g. color:["#C50063","#005572"])
Note 2 : Be carefull to specify different className for each type of feature
Events
You can listen for some events :
- onFeatureSelected : A click on a feature, return an object with the specific positions of this feature
- onZoom : When a zoom occurs, return an object with the coordinates and zoom level
Those methods take a custom function (callback) in parameter, receiving the event object, allowing you to link the event with the rest of your application.
Zoom
You can zoom into the feature viewer by selecting the area of interest with your mouse.
But you can also do it programmatically.
The feature-viewer has two methods for that :
- zoom(start,end) : A function that will zoom on the coordinates passed in parameters. (start must be > 0)
- resetZoom() : A function that will reset the zoom.
Use data
It is possible to fill the feature viewer with protein features from NeXtProt, the human protein database.
- First, find your protein of interest in NeXtProt and get the neXtProt accession (NX_...). (You can find your protein by entering an accession number of another database, like UniProt or Ensembl)
- Then, check the type of feature in the NeXtProt API that you would like to add to your viewer. For example, "propeptide" or "mature-protein".
- Include the feature viewer bundle with nextprot to your html : feature-viewer.nextprot.js
- Finally, create your feature viewer like this :
